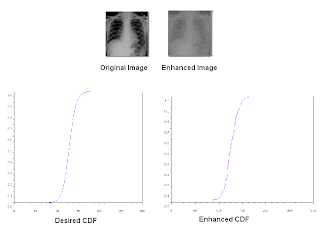
By back projecting the original array of image to the CDF of its histogram, it enhances both the image and the histogram of the original image.
Below are the histograms , CDF , output image of the original image and the enhanced image:


The source code of this image enhancement is written below:
a = imread("G:\Documents and Settings\Semicon_2\Desktop\X-Ray.jpg");
n = size(a);
row = n(1);
col = n(2);
b = im2gray(a);
c = 255*b;
x = [0:255];
//Loop for Histogram//
for d = 1:256
counter = 0.0; //Initialize count
for i = 1:row // Number of rows
for j = 1:col // Number of columns
if c(i,j) == d
counter = counter + 1.0;
end
x(d) = counter;
end
end
end
x1 = x/max(x);
x2 = cumsum(x1);
x3 = x2/max(x2);
c2 = c;
//Loop for Back - Projection//
for i = 1:row// Number of rows
for j = 1:col// Number of columns
c2(i,j) = x3(c(i,j)+1) ;
end
end
c3 = floor(255*c2);
x4 = [0:255];
//Loop for the final histogram//
for d = 1:256
counter = 0.0; //Initialize count
for i = 1:row // Number of rows
for j = 1:col // Number of columns
if c3(i,j) == d
counter = counter + 1.0;
end
x4(d) = counter;
end
end
end
x5 = x4/max(x4);
x6 = cumsum(x5);
x7 = x6/max(x6);
scf(1)
plot(x7);
scf(2)
imshow(c2);
scf(3);scf(1)
plot(x7);
scf(2)
imshow(c2);
scf(3);
imshow(b);
My modified program which includes a desired function G(z) which is a hyperbolic tangent with a form:
G = tanh(16*(z-128)/255);
The process of back-projection shown in a figure below:
 The value of the new image will come from the desired CDF. The resulting image is shown below:
I acknowledge the help extended byElizabeth Prieto and Rafael Jaculbia in debugging my program. I give myself a grade of 9 for the reason that I found it hard to understand how back-projection part.
Source:
profile.myspace.com
No comments:
Post a Comment